Airline Flight Delays Analysis
Project Information
- Category: Data Analytics / Business Intelligence / Aviation
- Client/Context: Quantum Analytics (Internship Project)
- Project Date: December 2023
- Tools Used: Power BI (Power Query, DAX)
- Data Source: 5,000,000+ commercial airline flights in 2015 (U.S. DOT)
- Project URL: View Live Dashboard
Airline Flight Delays and Cancellations Analysis
Summary
This project involved comprehensive analysis of over 5,000,000 commercial airline flight records from 2015, compiled for the U.S. DOT Air Travel Consumer Report. The primary objective was to uncover key insights into flight performance, including delay patterns and cancellation causes. Working with a dataset of this magnitude presented a significant technical challenge, requiring robust data cleaning, transformation, and optimization within Power BI to ensure efficient processing and responsive dashboard interactions. I developed a dynamic Power BI dashboard (as shown visually) to answer critical questions about flight volumes, delay percentages, average delay times, and airline reliability. The insights gained provide valuable intelligence for understanding operational efficiencies and passenger experiences within the U.S. air travel industry, highlighting areas for potential improvement in scheduling and service reliability.
1. Introduction: Deconstructing Airline Performance with Data
The vast amount of data generated by commercial airline operations holds immense potential for understanding the complexities of air travel. This project aimed to unlock that potential by diving into a substantial dataset of **over 5,000,000 commercial airline flights from 2015**, originally compiled for the U.S. DOT Air Travel Consumer Report. Each record detailed crucial information such as airline name, flight number, origin/destination airports, flight distance, and scheduled/actual departure and arrival times. The core challenge was to transform this massive raw data into actionable insights, providing a clear picture of flight delays and cancellations.
My role focused on leveraging Power BI to clean, model, and visualize this data, addressing specific analytical questions crucial for understanding overall air travel performance. The sheer volume of records necessitated a meticulous approach to data preparation and careful consideration of data model design to maintain optimal dashboard performance and responsiveness. The goal was to deliver a clear, interactive dashboard that could inform stakeholders about key trends and pain points in airline operations.
2. Project Objectives & Goals
The analysis was guided by specific questions to extract meaningful insights from the extensive flight data:
Overall Objectives:
- To process and analyze a large-scale dataset of over 5 million airline flights to identify patterns in delays and cancellations.
- To develop an intuitive Power BI dashboard that visually represents key flight performance metrics.
- To provide actionable insights into airline reliability and operational variations by time and location.
Project Goals & Deliverables:
- Analyze Flight Volume Trends:
- Quantify how overall flight volume varies by month.
- Quantify how overall flight volume varies by day of the week.
- Evaluate Departure Delays:
- Calculate the percentage of flights that experienced a departure delay in 2015.
- Determine the average delay time, in minutes, for delayed flights.
- Assess Delay Variation:
- Examine how the percentage of delayed flights varies throughout the year.
- Specifically analyze the percentage of delayed flights originating from Boston (BOS).
- Investigate Flight Cancellations:
- Determine the total number of flights cancelled in 2015.
- Break down cancellation causes: percentage due to weather vs. percentage due to Airline/Carrier.
- Identify Airline Reliability:
- Identify the airlines that are most reliable in terms of on-time departure.
- Identify the airlines that are least reliable in terms of on-time departure.
3. Data Scope & Metrics
The analysis leveraged a single, comprehensive dataset provided for the U.S. DOT Air Travel Consumer Report.
Data Source:
- Commercial Airline Flight Records (CSV): Over 5,000,000 individual flight records from 2015. Each record included:
- Airline Name
- Flight Number
- Origin Airport
- Destination Airport
- Flight Distance
- Scheduled Departure/Arrival Times
- Actual Departure/Arrival Times
- Delay Information (Departure Delay, Arrival Delay)
- Cancellation Information (Cancelled Flag, Cancellation Reason - e.g., Weather, Carrier, Security)
Key Data Points & Metrics Captured and Calculated:
- Total Flights: Overall count of flights.
- Departure Delay (Minutes): Sum of all departure delay minutes.
- On Time Departure: Count of flights that departed on time.
- Cancelled Flights: Total number of flights cancelled.
- Airports: Total number of unique airports involved.
- Total Flights: Overall number of flights in the dataset.
- Avg Departure Delay: Average delay time for delayed flights (e.g., 33 minutes).
- % Departure Delay: Percentage of flights experiencing a departure delay (e.g., 37%).
- % Spread of Delayed Flights from BOS by Month: Monthly trend of delayed flights specifically from Boston.
- % Delayed Flights by Month: Monthly trend of overall delayed flights.
- Cancelled Flights by Cancellation Reason: Breakdown by Weather, Airline/National, Security, Not Cancelled.
- Most Reliable Airlines: Airlines with highest on-time performance.
- Least Reliable Airlines: Airlines with lowest on-time performance (highest delays).
- Total Flights by Month, Weekday and weekday name: Detailed breakdown of flight volume by temporal dimensions.
Key Insights Derived from Data (Pre-Dashboard):
- Initial data exploration confirmed the high volume of records, emphasizing the need for efficient Power Query and DAX strategies.
- Preliminary analysis indicated seasonal variations in flight delays, with certain months exhibiting higher percentages.
- The breakdown of cancellation reasons immediately highlighted weather and carrier issues as primary drivers.
- Identifying most and least reliable airlines revealed significant performance disparities across different carriers.
4. Dashboard Design & Key Insights (Based on Visual Analysis)
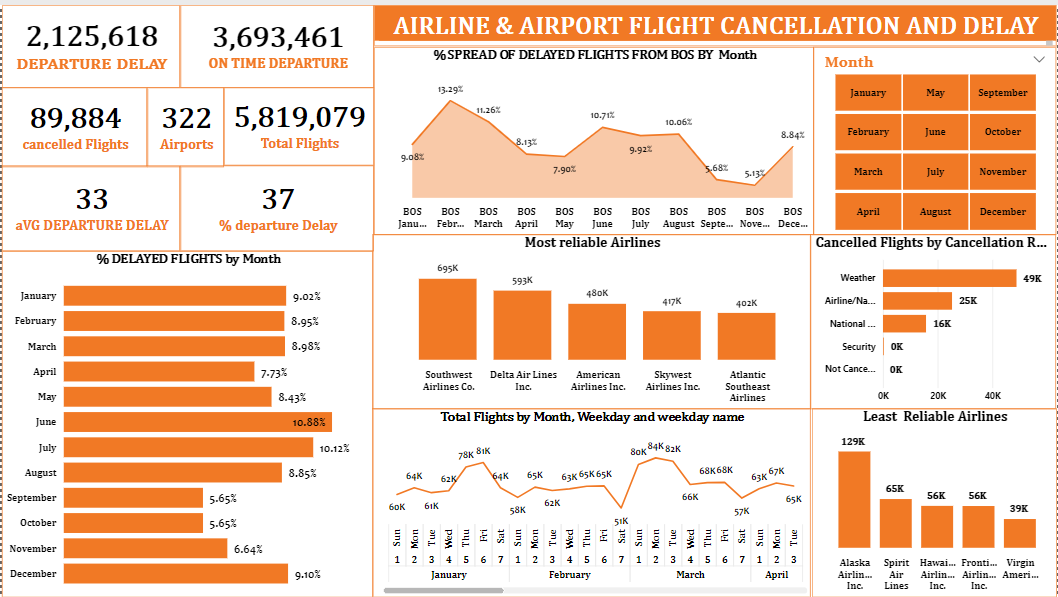
The project culminated in an interactive Power BI dashboard, the "Airline & Airport Flight Cancellation and Delay" dashboard, designed to provide clear, actionable insights into airline performance.
Dashboard Features and Key Insights from the "Airline & Airport Flight Cancellation and Delay" Dashboard:
4.1 Executive Summary & Key Performance Indicators (KPIs)
The dashboard's top section provides an immediate overview of critical aggregated metrics:
- Departure Delay (Minutes): `2,125,618` – Total minutes of departure delays.
- On Time Departure: `3,693,461` – Total flights departed on time.
- Cancelled Flights: `89,884` – Total number of flights cancelled.
- Airports: `322` – Total unique airports in the dataset.
- Total Flights: `5,819,079` – Overall number of flights analyzed.
- Avg Departure Delay: `33` – Average delay time in minutes for delayed flights.
- % Departure Delay: `37%` – Percentage of flights that experienced a departure delay.
These KPIs provide a high-level summary of the overall flight performance and impact of delays.
4.2 Temporal Trends & Delay Distribution
These charts reveal how delays fluctuate over time:
- % Spread of Delayed Flights from BOS by Month (Area Chart): Shows monthly variations in delayed flights specifically from Boston (BOS). There are peaks in February (13.25%), May (11.26%), and October (10.71%), indicating specific periods where BOS departures are more prone to delays. This is crucial for airport-specific operational planning.
- % Delayed Flights by Month (Bar Chart): Presents the overall percentage of delayed flights each month. June (10.88%) and July (10.12%) show the highest percentages, aligning with peak travel seasons. This informs general seasonal operational adjustments.
- Total Flights by Month, Weekday and weekday name (Line Chart): Provides a detailed view of flight volume across months and days of the week. Weekends (especially Saturday and Sunday) generally show higher flight volumes in specific months like January, February, and March. This helps understand overall demand patterns.
4.3 Cancellation Analysis
Understanding why flights are cancelled is vital for risk mitigation:
- Cancelled Flights by Cancellation Reason (Bar Chart):
- `Weather (49K)`
- `Airline/National (16K)`
- `Security (0K)`
- `Not Cancelled (0K)`
This chart clearly indicates Weather as the predominant reason for flight cancellations, followed by Airline/National issues. This is a critical insight for operational resilience planning.
4.4 Airline Reliability Assessment
These charts identify top and bottom performers:
- Most Reliable Airlines (Bar Chart): Southwest Airlines Co. (695K flights), Delta Air Lines Inc. (593K flights), and American Airlines Inc. (480K flights) appear to be the most reliable, likely in terms of on-time departure volume. This helps recognize strong performers.
- Least Reliable Airlines (Bar Chart): Spirit Airlines (129K flights), Hawaiian Airlines Inc. (65K flights), and Frontier Airlines Inc. (56K flights) are highlighted as least reliable. This pinpoints airlines requiring potential investigation for service improvement.
4.5 Interactive Filters
- Month Slicer: Allows filtering data by specific months (January, February, March, May, September, June, October, July, November, April, August, December). This enables focused analysis on seasonal trends.
The dashboard provides a comprehensive view of critical airline performance metrics, enabling stakeholders to quickly identify trends, understand causes of delays and cancellations, and assess airline reliability.
5. Technical Approach & Tools
I executed this project following a meticulous data analysis and business intelligence pipeline:
- Data Acquisition & Ingestion: The project began with the ingestion of the large CSV file containing over 5,000,000 flight records into Power BI Desktop.
- Data Cleaning & Transformation (Power Query in Power BI): This was a critical phase due to the sheer volume of data. I employed efficient Power Query techniques to handle potential data inconsistencies and prepare the dataset for analysis. This included:
- Handling missing values or errors in key fields.
- Ensuring correct data types for dates, times, numerical values, and categorical data.
- Creating calculated columns for delay minutes and percentage of delay, based on scheduled and actual times.
- Parsing cancellation reasons to enable accurate categorization and aggregation.
- Optimizing query steps to reduce load times and improve performance when working with millions of rows.
- Data Modeling (Power BI Desktop): A robust data model was established to facilitate relationships and calculations across the large dataset. Key considerations included:
- Creating a calendar table if not already present, to enable time-based analysis (monthly, daily, weekday trends).
- Optimizing data storage mode (e.g., Import vs. DirectQuery) and columnar storage for performance.
- Establishing appropriate relationships between tables (if any additional lookups were created) to ensure data integrity and efficient filtering.
- DAX (Data Analysis Expressions) Calculations: I wrote complex DAX measures to derive key performance indicators (KPIs) and enable dynamic calculations, including:
- `Total Departure Delay Minutes`
- `Total On-Time Departures`
- `Total Cancelled Flights`
- `Average Departure Delay (for delayed flights)`
- `% of Flights with Departure Delay`
- Measures to categorize and sum cancellation reasons (Weather, Carrier, etc.).
- Measures to rank airlines by reliability.
- Data Visualization & Dashboarding (Power BI Desktop): I meticulously designed the interactive dashboard using appropriate visualization types to address the project objectives:
- KPI Cards: For immediate summary of overall performance metrics like total delays, on-time departures, and cancellations.
- Bar Charts: For categorical breakdowns (e.g., Most/Least Reliable Airlines, Cancelled Flights by Reason) and monthly delay percentages.
- Area Charts: For visualizing temporal trends like % spread of delayed flights from BOS and Total Flights by Pickup Time, allowing for easy identification of peaks and troughs.
- Slicers: For dynamic filtering by Month, providing user interactivity and enabling deeper exploration of specific periods.
- Publishing & Sharing (Power BI Service): The final interactive report was published to the Power BI Service, enabling secure sharing and access for stakeholders.
6. Impact & Business Value
This Airline Flight Delays Analysis project provides significant business value for stakeholders in the aviation industry, including airlines, regulatory bodies (like the U.S. DOT), and even travelers:
- Enhanced Operational Awareness: Provides a clear, data-driven understanding of flight delay and cancellation patterns, enabling airlines to identify recurring issues and improve operational planning and resource allocation.
- Informed Decision-Making: Regulators can use these insights to monitor airline performance, identify areas for policy intervention, and improve consumer reporting accuracy.
- Improved Passenger Experience: By understanding peak delay times and reasons for cancellations, airlines can better manage passenger expectations, communicate proactively, and potentially reduce disruptions.
- Airline Performance Benchmarking: The identification of most and least reliable airlines provides a basis for benchmarking and competitive analysis, encouraging airlines to strive for better on-time performance.
- Strategic Resource Allocation: Knowledge of flight volume by month and day of the week allows for better staffing and scheduling of airport personnel, ground crews, and flight attendants.
- Data-Driven Problem Solving: The dashboard serves as a foundational tool for further root-cause analysis of delays and cancellations, leading to more targeted and effective solutions.
- Demonstrated Big Data Capability: Successfully handling and deriving insights from a dataset of over 5 million records highlights strong data processing and analysis capabilities for large volumes of data.
7. Conclusion
This Airline Flight Delays Analysis project successfully transformed a massive dataset of over 5 million commercial flight records into a powerful and intuitive Power BI dashboard. By meticulously cleaning the data and developing targeted visualizations, I was able to answer key questions regarding flight volumes, delay trends, and cancellation reasons, and assess airline reliability. Working with such a large dataset presented a valuable technical challenge, which was successfully navigated through careful data modeling and Power Query optimization. The dashboard serves as a vital tool for understanding the complexities of air travel performance, providing actionable insights for airlines, regulatory bodies, and contributing to a better passenger experience. This project underscores the significant impact that robust data analysis and visualization can have on complex operational challenges in the transportation sector.